
The TAM Trap - Why Your Market Size Slide Might Be Costing You Investors
- Vaibhav Gupta

- Jul 10, 2025
- 6 min read
Updated: Jul 22, 2025
Dear Founders,
Have you ever wondered why your pitch deck isn't getting the investor meetings you hoped for? The culprit might be hiding in one of the most deceptively simple slides: your Total Addressable Market (TAM). Today, we're diving deep into why most founders get TAM wrong and how you can avoid these costly mistakes.
The Scene: A Coffee Shop in Koramangala, Bengaluru
Raj, a first-time founder of a fintech startup, sits across from Priya, an experienced venture capitalist. The aroma of filter coffee fills the air as Raj excitedly opens his laptop.
Raj: "...and as you can see, the digital payments market in India is currently valued at ₹7.1 lakh crore. Since our app facilitates digital payments for small businesses, that's our TAM!"
Priya takes a sip of her coffee, hiding a slight smile.
Priya: "That's interesting. So you're saying your startup will capture the entire digital payments market in India?"
Raj: "Well, no. Maybe 2-3% of it?"
Priya: "Then why is that your TAM?"
Raj pauses, suddenly uncertain.
Priya: "Let me guess—you're showing me the size of the problem, not the size of your potential business."
The TAM Trap: Three Common Mistakes
Mistake #1: Confusing the Size of the Problem with Your Revenue Opportunity
Many founders fall into this trap. They say things like:
"Indians waste ₹45,000 crores annually on food spoilage, and we're here to fix that!"
This describes the size of the problem, not how much revenue your business can generate by solving it. If your app helps reduce food waste by alerting users about expiring items, your revenue might come from subscription fees or advertising—not from capturing the value of all wasted food.
Mistake #2: The "Percentage of a Huge Market" Fallacy
"The Indian wedding industry is worth ₹4 lakh crore annually. If we capture just 1% of that with our wedding planning app..."
This top-down approach sounds impressive but rarely convinces savvy investors. It doesn't show a deep understanding of your specific customers or how your business model works.
Mistake #3: Claiming Markets You Can't Actually Serve
"Our AI-powered agricultural advice platform targets all 140 million farmers in India."
But what if your platform requires:
Smartphone ownership
Regular internet access
English or Hindi language proficiency
Certain types of crops
Suddenly, your actual addressable market might be 5-10 million farmers, not 140 million.
The Right Way: Building a Bottom-Up TAM
Let's return to our coffee shop conversation:
Priya: "Raj, instead of starting with the total digital payments market, tell me exactly who your customers are and how they'll pay you."
Raj: "Well, we're targeting kirana stores in Tier 2 and 3 cities that currently don't accept digital payments. Based on our research, there are approximately 12 million such stores across India."
Priya: "Good. And what will each store pay you?"
Raj: "We charge ₹1,500 per year for the basic package, and we expect about 40% of users to upgrade to our premium package at ₹3,600 per year."
Priya: "Now we're getting somewhere. Let's do the math together."
A Data-Driven Approach to Calculating TAM
Here's how Raj should calculate his TAM:
Let me explain how this TAM (Total Addressable Market) calculation works step by step:
The Foundation: Bottom-Up Approach
Raj is using a bottom-up approach by starting with specific customer segments and their actual pricing rather than taking a percentage of a large market.
Understanding Each Row of the Table
Row 1: Basic Tier Customers
Customer Segment: Kirana stores that will use the basic package
Number of Customers: 7.2 million stores
This comes from an assumption that 60% of the total 12 million potential kirana stores will choose the basic package
Calculation: 12 million × 60% = 7.2 million stores
Annual Revenue per Customer: ₹1,500
This is the yearly subscription fee for the basic package
Total Revenue Potential: ₹10,800 crores
Calculation: 7.2 million stores × ₹1,500 per store = ₹10,800 crores
(Note: 1 crore = 10 million rupees)
Row 2: Premium Tier Customers
Customer Segment: Kirana stores that will use the premium package
Number of Customers: 4.8 million stores
This assumes 40% of total kirana stores will choose the premium option
Calculation: 12 million × 40% = 4.8 million stores
Annual Revenue per Customer: ₹3,600
This is the yearly subscription fee for the premium package
Total Revenue Potential: ₹17,280 crores
Calculation: 4.8 million stores × ₹3,600 per store = ₹17,280 crores
Row 3: Total TAM
Total Number of Customers: 12 million (7.2 million + 4.8 million)
Weighted Average Revenue: ₹2,340 per customer
This represents the average revenue across all customers when considering the mix of basic and premium subscriptions
Calculation: ((7.2M × ₹1,500) + (4.8M × ₹3,600)) ÷ 12M = ₹2,340
Total Revenue Potential: ₹28,080 crores
This is the sum of revenue from both segments
Calculation: ₹10,800 crores + ₹17,280 crores = ₹28,080 crores
Alternative calculation: 12 million stores × ₹2,340 average revenue = ₹28,080 crores
Why This Method Is Effective
Segment-Specific: It acknowledges different types of customers will pay different amounts
Realistic Pricing: Uses actual pricing tiers rather than hypothetical figures
Complete Picture: Shows both the total market size and the breakdown by segment
Defendable: Each number has a clear rationale that can be explained to investors
Key Assumptions to Validate
The strength of this TAM calculation depends on validating several key assumptions:
Is 12 million the correct number of kirana stores that could potentially use this solution?
Is the 60/40 split between basic and premium packages realistic?
Are the pricing points (₹1,500 and ₹3,600) validated by market research or customer interviews?
A good TAM calculation like this one becomes even stronger when you can point to research or early market testing that validates these assumptions.
This bottom-up approach:
Starts with specific customer segments
Uses realistic pricing that you've validated
Shows the math clearly
Can be defended with data and research
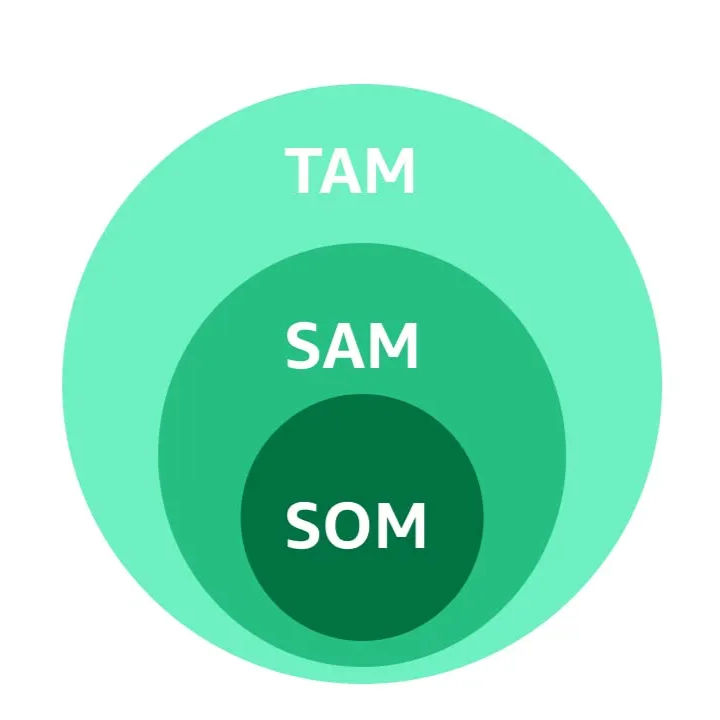
Beyond TAM: Understanding SAM and SOM
Raj: "But realistically, we can't reach all 12 million stores right away."
Priya: "Exactly. That's where SAM and SOM come in."
Serviceable Addressable Market (SAM) is the portion of your TAM that you can realistically target based on your go-to-market strategy, geographic focus, and product capabilities.
For Raj's startup, the SAM might be:
Kirana stores in states where his company plans to operate initially (Gujarat, Maharashtra, Karnataka)
Stores with owners who have smartphones
Areas with reliable internet connectivity
This narrows his initial target market to perhaps 3 million stores, making his SAM approximately ₹7,020 crores.
Serviceable Obtainable Market (SOM) is the portion of your SAM that you can realistically capture in the next 3-5 years.
Given competition and market dynamics, Raj might target capturing 15% of his SAM over five years, giving him a SOM of approximately ₹1,053 crores.
A Real-World Example: Dukaan vs. ShopX
Consider two Indian startups with similar-sounding missions but very different TAMs:
Dukaan: Helps small retailers create online storefronts
TAM: 15 million small retailers in India × average subscription of ₹6,000/year = ₹9,000 crores
ShopX: B2B platform connecting retailers with FMCG brands
TAM: 12 million kirana stores × average annual procurement of ₹24 lakhs × 2% commission = ₹57,600 crores
Same customer base, entirely different business models and revenue potentials.
The Investor Perspective
Back at the coffee shop:
Priya: "When I see a realistic, bottom-up TAM calculation, it tells me three things: First, you understand your customers. Second, you've thought deeply about your business model. And third, you're honest about your market opportunity."
Raj: "But isn't a smaller TAM less attractive?"
Priya: "Not necessarily. I'd rather invest in a startup that can capture 30% of a ₹10,000 crore market than one claiming it'll get 1% of a ₹10 lakh crore market with no clear path to do so."
Actionable Steps for Your Pitch Deck
Do the research: Find reliable data on your specific customer segments in India
Test your pricing: Validate your assumptions through customer conversations
Show the math: Use clear calculations and cite your sources
Be realistic: Better to underestimate and overdeliver
Tell a growth story: Show how your TAM expands as you add features, markets, or customer segments
Final Thoughts
Your TAM slide isn't just about showing a big number. It's about demonstrating that you understand the size of the opportunity and have a realistic plan to capture it. Remember, investors aren't looking for startups that will get 1% of a massive market; they're looking for startups that will dominate their specific niche.
As Raj leaves the coffee shop with a newfound understanding of TAM, he realizes his pitch deck needs some serious reworking. But with a clearer vision of his true market opportunity, he's more confident than ever in his startup's potential.
Have a funding question? Reply to this newsletter, and we might feature your question in our next issue.
Keep Building, The Build3 Team
Building with Build3 is a biweekly newsletter helping Indian entrepreneurs build better startups. Subscribe for more insights on fundraising, product development, and scaling your business.
Disclaimer: This newsletter is for educational purposes only and should not be considered as investment or legal advice. Always consult with qualified professionals before making funding decisions.


Comments